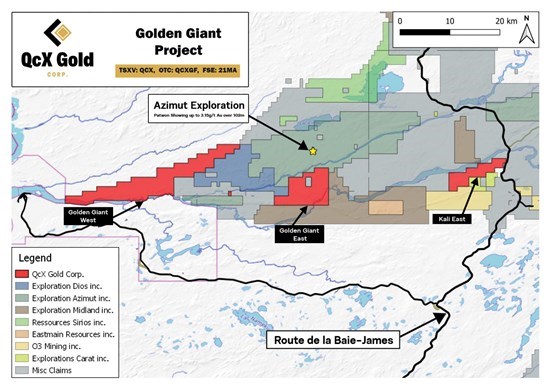
Montreal, Quebec–(Newsfile Corp. – December 1, 2020) – QcX Gold Corp. (TSXV: QCX) (OTC Pink: QCXGF) (FSE: 21MA) (“QcX” or the “Company“) is pleased to announce results from its Phase 2 exploration program on its 100% owned Golden Giant East project (“Golden Giant East” or “GGEast“). The overall Golden Giant project (“Golden Giant Project“) is comprised of 3 properties, Golden Giant West (“GGWest“), GGEast and the Kali East (“Kali East“) block, covering approximately 18,992 hectares and is contiguous to Azimut Exploration Inc.’s Patwon project as shown in Figure 1. Following up on exploration success of the Phase 1 program, QcX Gold has identified additional gold mineralization from grab and channel samples on the GGEast property returning up to 4.6 g/t Au along with other anomalous samples of interest as shown in Figure 2 and Table 1.
Aaron Stone, Vice President Exploration of QcX, stated, “These gold results validate our interest in the area and warrant additional follow up exploration. The GGEast Block, being the closest of our three Golden Giant properties to Azimut’s Elmer discoveries, is delivering some excellent gold results. We are seeing strongly anomalous gold mineralization expressed at surface in multiple areas and in multiple differing geological units. We will be following up on all these areas of interest with a comprehensive Induced Polarisation ‘IP’ geophysical survey which will help us identify sub-surface disseminated sulphides on the properties. The results of this survey will be interpreted and evaluated with existing data sets to produce definitive targets for our inaugural drill program envisioned for Q2 of next year.” Click here to hear directly from Aaron Stone on the Golden Giant Project as he reviews today results in more detail.
Cannot view this video? Visit:
https://www.youtube.com/watch?v=_Z-wRGlRnwg
A total of 424 grab and channel samples were taken from GGEast in the Phase 2 exploration program. Of these, 24, or 5.7% of the total samples analyzed, returned anomalous values greater than 200 ppb Au as shown in Figure 2 and Table 1. 12 samples, or 2.8% of the total samples analyzed, returned greater than 0.5 g/t Au, with the highest grab sample returning 4.6 g/t Au.
Figure 1: Location of the Golden Giant Project (red) with respect to neighbouring companies.
To view an enhanced version of Figure 1, please visit:
https://orders.newsfilecorp.com/files/1791/64716_ccd9ed3854154afa_001full.jpg
Table 1: Results over 200 ppb from Phase-II on Golden Giant East property.
| Sample ID | UTM-E | UTM-N | Zone | Au g/t | Ag g/t | Cu % |
| A684780 | 321072 | 5793534 | 18 | 4.6 | 16.1 | 0.393 |
| A684596 | 318555 | 5794754 | 18 | 4.12 | 10.6 | 0.588 |
| A684944 | 318949 | 5789887 | 18 | 1.02 | 0.3 | 0.0486 |
| A684592 | 318551 | 5794764 | 18 | 1.02 | 7.5 | 0.396 |
| A684691 | 320984 | 5795494 | 18 | 0.99 | < 0.2 | 0.0079 |
| A684597 | 318552 | 5794755 | 18 | 0.876 | 3.7 | 0.0132 |
| A684923 | 318149 | 5793615 | 18 | 0.866 | < 0.2 | 0.0003 |
| A684672 | 321137 | 5793322 | 18 | 0.791 | < 0.2 | 0.012 |
| A684622 | 318316 | 5794676 | 18 | 0.788 | 6.8 | 0.324 |
| A684837 | 317319 | 5791559 | 18 | 0.527 | 2 | 0.486 |
| A684594 | 318555 | 5794756 | 18 | 0.522 | 3.5 | 0.258 |
| A684748 | 318555 | 5794754 | 18 | 0.498 | 4.8 | 0.287 |
| A684601 | 318722 | 5791770 | 18 | 0.488 | 13.9 | 0.42 |
| A684825 | 316462 | 5793062 | 18 | 0.486 | 0.5 | 0.007 |
| A684529 | 316608 | 5793997 | 18 | 0.448 | 4.1 | 0.0347 |
| A684836 | 317319 | 5791559 | 18 | 0.434 | 2.5 | 0.368 |
| A684670 | 321211 | 5793364 | 18 | 0.420 | < 0.2 | 0.0005 |
| A684591 | 318549 | 5794759 | 18 | 0.340 | 5.9 | 0.121 |
| A684922 | 318149 | 5793616 | 18 | 0.339 | 0.2 | 0.0003 |
| A684595 | 318555 | 5794754 | 18 | 0.283 | 0.7 | 0.0232 |
| A684838 | 317319 | 5791559 | 18 | 0.251 | 0.6 | 0.172 |
| A684749 | 318555 | 5794754 | 18 | 0.228 | 2.6 | 0.152 |
| A684954 | 320948 | 5794708 | 18 | 0.213 | 1.5 | 0.0437 |
| A684831 | 317319 | 5791559 | 18 | 0.210 | 0.8 | 0.0456 |
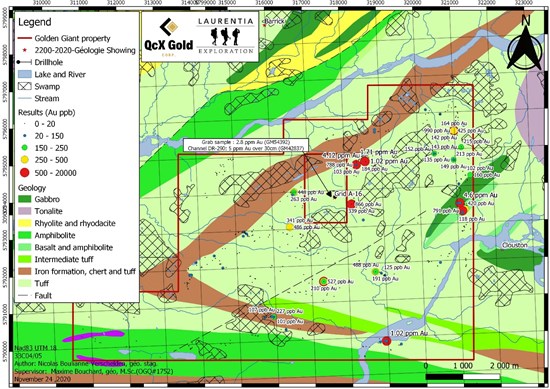
Figure 2: Results from the Phase 2 prospecting program on Golden Giant East, underlain by geology. Labelled values are > 100 ppb Au.
To view an enhanced version of Figure 2, please visit:
https://orders.newsfilecorp.com/files/1791/69216_d07857d054528afe_002full.jpg
Gold mineralization occurs in a variety of settings, including:
- Centimetric vein hosted in an andesitic sequence composed of an alternance of ash to bloc tuffs and pillowed lavas. The vein can be traced over 10 metres, is irregular, with pull apart textures, and is composed of quartz, chlorite and carbonates and locally contains up to 5% chalcopyrite and 3% pyrite. Samples taken during Phase 1 returned up to 1.71 ppm Au. Samples taken during Phase 2 from the same vein have returned results of up to 4.12 ppm Au. Another vein proximal to the first, also returned results up to 1.02 ppm Au. This vein is compositionally identical but has a more regular form. Other similar veins were found 250 metres west with up to 788ppb Au.
- Network of quartz veins with thicknesses up to 20 centimetres holding up to 2% pyrite with a metre-wide alteration halo in a felsic tuff. The vein network can be traced over 20 metres. Samples grading up to 425 ppb Au were taken during Phase 1. Phase 2 saw multiple additional samples taken, both grab and channel. The highest grading results were 990 ppb, 142 ppb and 71 ppb Au in a batch of 10 samples taken from the outcrop.
- A centimetric quartz vein containing 2% native copper hosted in a 10 cm felsic intrusion, injected in a gabbro, returning 4.6 ppm Au. A sample was also taken from the gabbro not containing the vein or felsic injection and returned 38 ppb Au. Samples up to 791 ppb and 420 ppb Au were taken ~200m south in an additional quartz vein.
- Quartz vein 5-10 cm wide with up to 8% pyrite have returned results of 866 ppb and 339 ppb Au. The veins are in an intermediate intrusive.
- Quartz-biotite vein 25 cm wide with up to 5% chalcopyrite and 2% pyrite. The highest grading results were 527 ppb, 488 ppb and 434 ppb Au.
- Quartz vein 4 cm thick containing 2% pyrite clusters was found in a semi-detached boulder. Sample taken from this boulder returned 1.02 ppm Au.
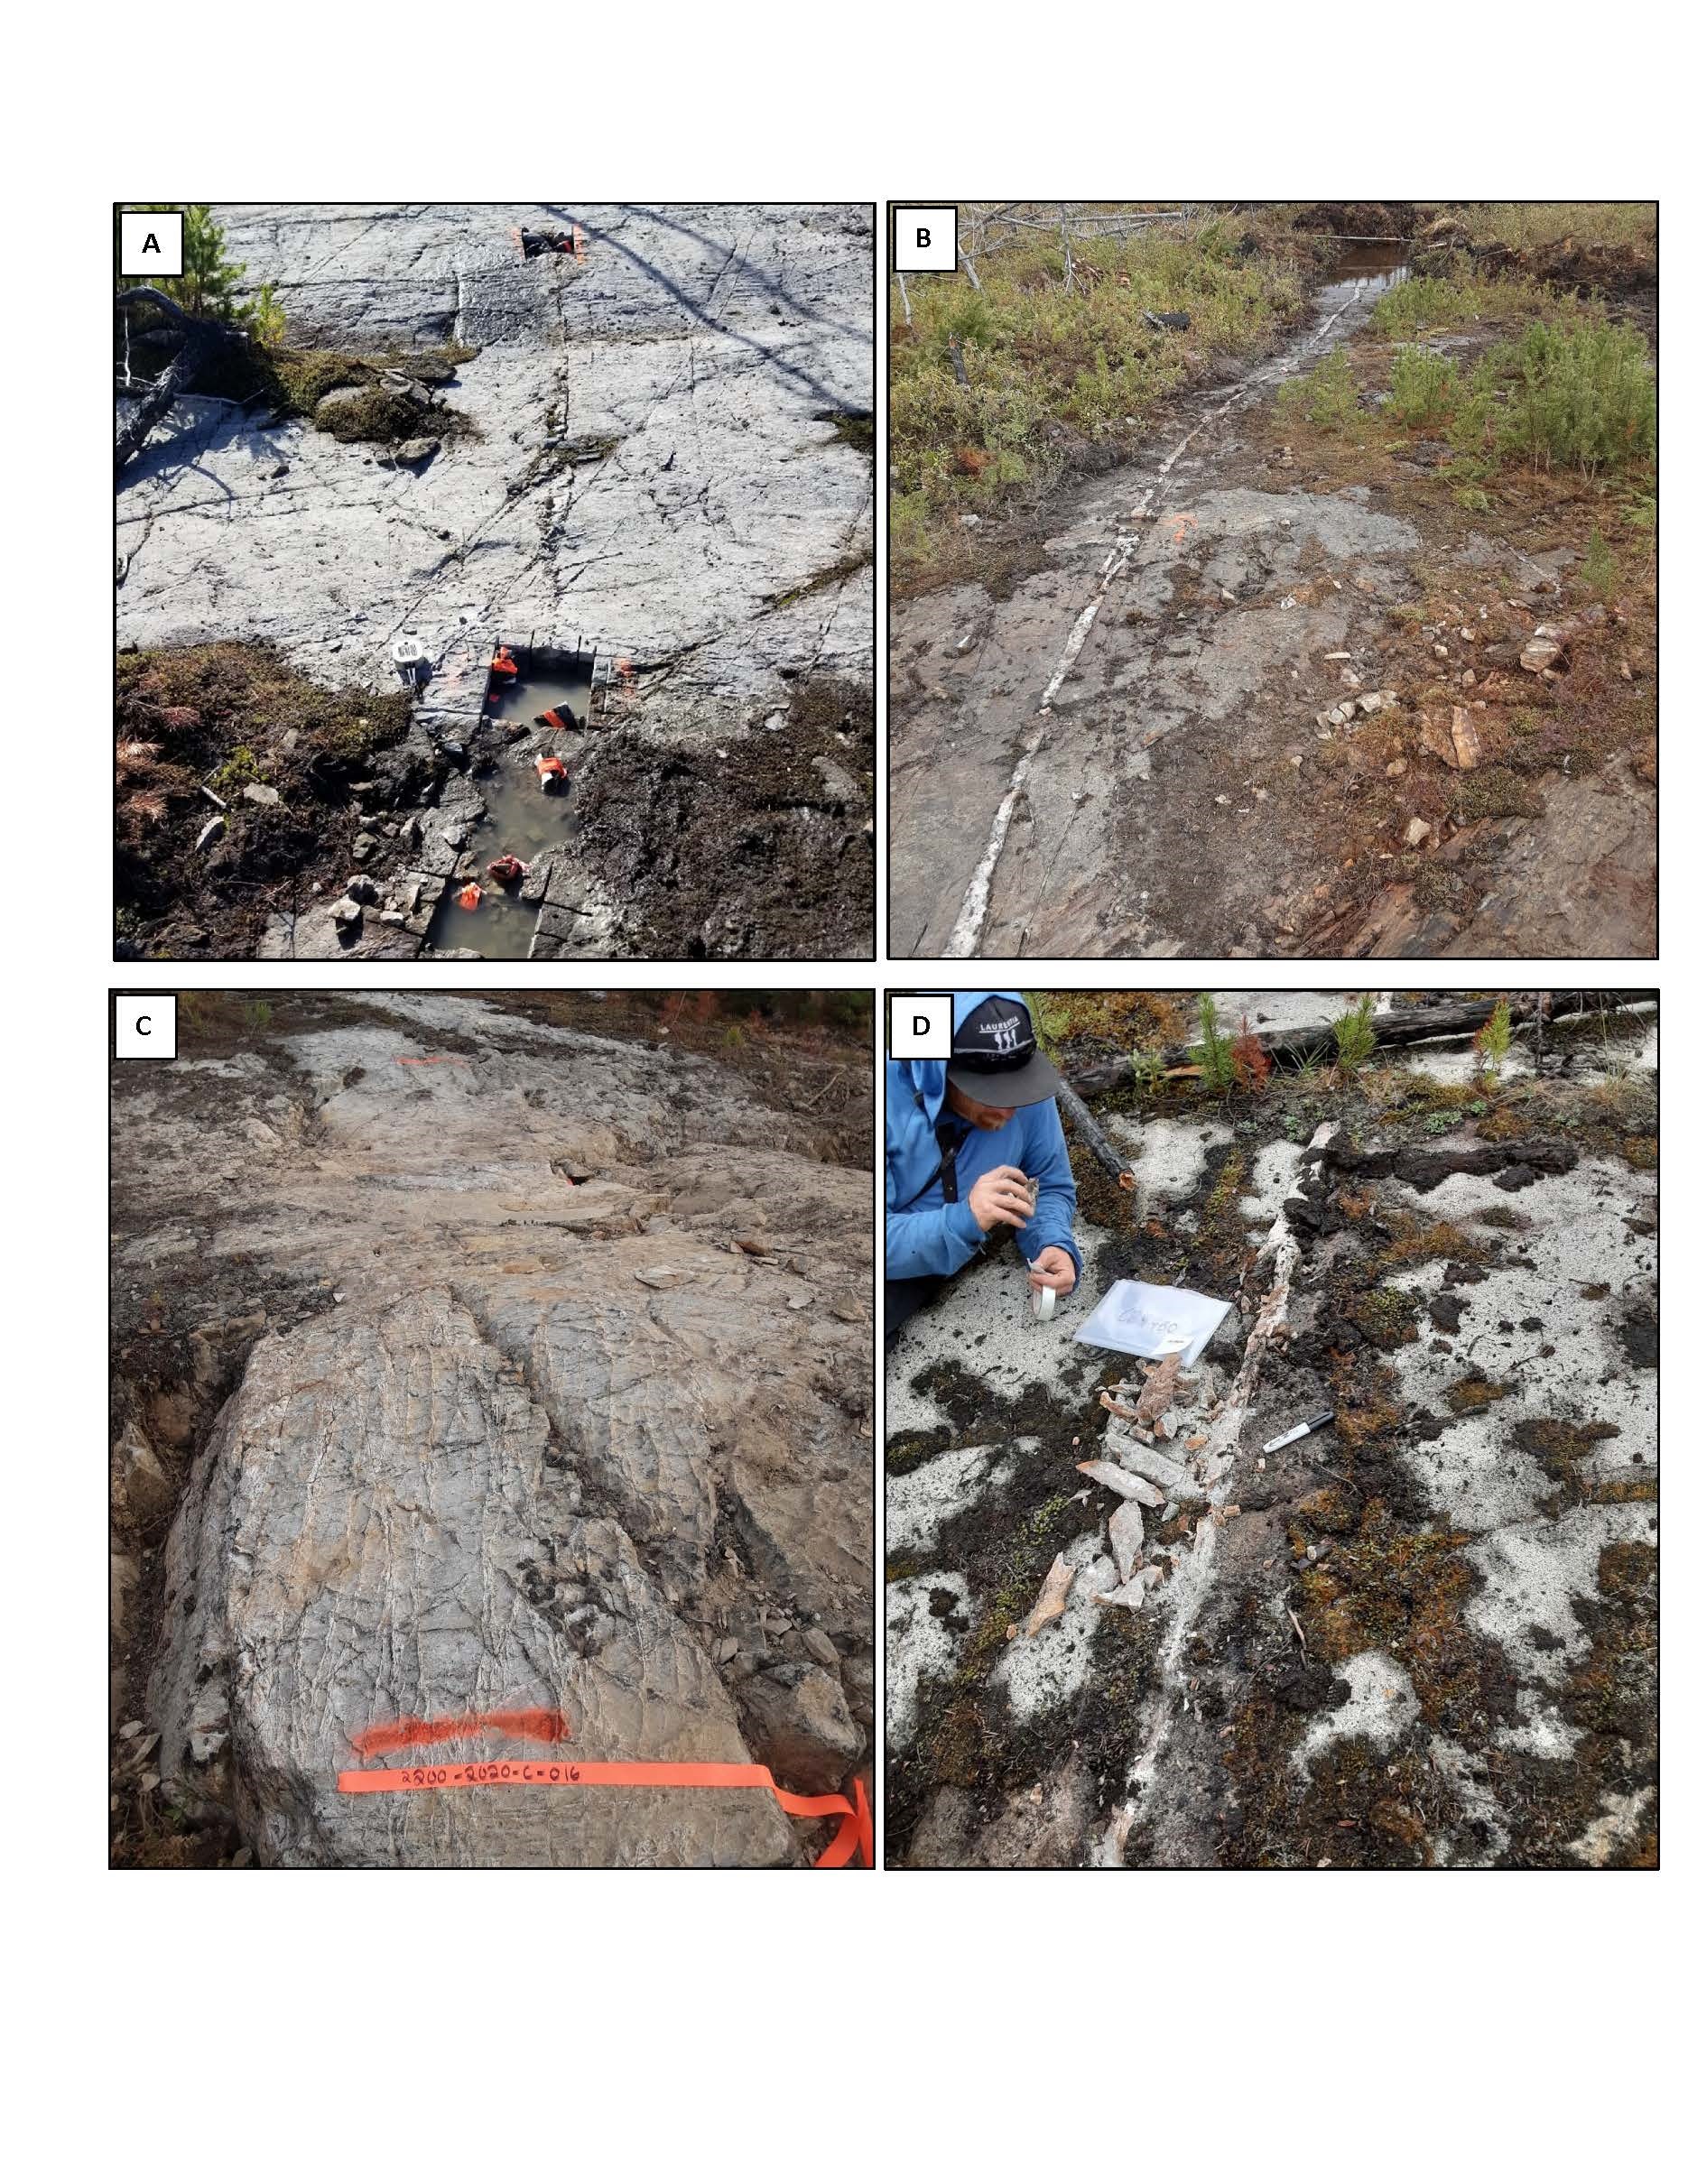
Figure 3: Field photos from Phase 2 work: A – Vein varying between 1-5 centimetres in width, composed of quartz, chlorite and carbonates, locally containing up to 5% chalcopyrite and 3% pyrite with results of up to 4.12ppm Au. B – Continuous vein varying between 5-10 centimetres traced over 12 metres composed of quartz, chlorite and carbonates, locally containing up to 5% chalcopyrite and 3% pyrite with results of up to 1.02ppm Au. C – Quartz vein network (thicknesses up to 20 centimeters) with up to 2% pyrite and a metre-wide alteration halo in a felsic tuff with results of up to 990 ppb Au. D – Centimetric quartz vein containing 2% native copper in a 10 cm felsic intrusion, injected in a gabbro with results up to 4.6 ppm Au.
To view an enhanced version of Figure 3, please visit:
https://orders.newsfilecorp.com/files/1791/69216_d07857d054528afe_003full.jpg
Qualified Person
Maxime Bouchard P.Geo. M.Sc.A., (OGQ 1752), a Qualified Person (“QP“) as such term is defined by National Instrument 43-101 – Standards of Disclosure for Mineral Projects, has reviewed and approved the geological information reported in this news release. The QAQC protocol used during the prospecting program consisted of the insertion of a blank or standard every 20 samples on average in addition to the regular insertion of blank, duplicate, and standard samples accredited by ACTLABS. Analytical work was completed at ACTLABS at their Timmins, Ontario facility. Gold values were analyzed by fire assay with finish by atomic absorption and values over 10 ppm Au are reanalyzed by fire assay with finish by gravimetry.
Grab samples are selective by nature and are unlikely to be representative of average grades. Field work and sampling were completed by Laurentia Exploration.
About QcX Gold
QcX Gold is exploring for gold and VMS style mineralization on its highly prospective and well-located properties in Quebec, Canada. The Golden Giant Project is located in the James Bay region of Quebec, only 2.9 km away from Azimut Exploration Inc.’s Pawton discovery on their Elmer gold project. The Fernet Project is located in the Abitibi Greenstone Belt in the Province of Quebec and is contiguous with Wallbridge Mining Company Limited’s Fenelon/Martinière property. Both properties are in close proximity to major discoveries which bodes well for exploration.
For further information, please contact:
Aaron Stone
Vice President Exploration
[email protected]
514-235-6012
Neither the TSX Venture Exchange nor its Regulation Services Provider (as that term is defined in the policies of the TSX Venture Exchange) accepts responsibility for the adequacy or accuracy of this release.
Forward-looking statements:
This news release contains forward-looking statements. All statements, other than of historical facts, that address activities, events or developments that the Company believes, expects or anticipates will or may occur in the future including, without limitation, the planned exploration program, the expected positive exploration results, the timing of the exploration results, the ability of the Company to continue with the exploration program, the availability of the required funds to continue with the exploration and the potential mineralization or potential mineral resources are forward-looking statements. Forward-looking statements are generally identifiable by use of the words “will”, “should”, “continue”, “expect”, “anticipate”, “estimate”, “believe”, “intend”, “to earn”, “to have’, “plan” or “project” or the negative of these words or other variations on these words or comparable terminology. Forward-looking statements are subject to a number of risks and uncertainties, many of which are beyond the Company’s ability to control or predict, that may cause the actual results of the Company to differ materially from those discussed in the forward-looking statements. Factors that could cause actual results or events to differ materially from current expectations include, among other things, failure to meet expected, estimated or planned exploration expenditures, failure to establish estimated mineral resources, the possibility that future exploration results will not be consistent with the Company’s expectations, general business and economic conditions, changes in world gold markets, sufficient labour and equipment being available, changes in laws and permitting requirements, unanticipated weather changes, title disputes and claims, environmental risks as well as those risks identified in the Company’s annual Management’s Discussion and Analysis. Should one or more of these risks or uncertainties materialize, or should assumptions underlying the forward-looking statements prove incorrect, actual results may vary materially from those described and accordingly, readers should not place undue reliance on forward-looking statements. Although the Company has attempted to identify important risks, uncertainties and factors which could cause actual results to differ materially, there may be others that cause results not to be as anticipated, estimated or intended. The Company does not intend, and does not assume any obligation, to update these forward-looking statements except as otherwise required by applicable law.

To view the source version of this press release, please visit https://www.newsfilecorp.com/release/69216
